
Project Overview
The West Indies represent one of the five primary biodiversity hot spots in the world, paradoxically characterized by high vascular plant and vertebrate endemism, as well as high rates of land-use transformations. Though it is threatened and poorly surveyed, the West Indian Cloud Forest is one such hot spot. Aside from studies of tree lianas, vascular epiphytes, and tree ferns, few quantitative analyses have been conducted to determine overall cloud forest biodiversity, growth forms, and morphology. Data from floristic inventories suggest that bryophytes represent prominent members of this forest type. However, the lack of a quantitative sampling approach in the West Indies has limited our understanding of this region’s ecological diversity, dominant species fauna, and micro-canopy structure. This information, while also critical to restoration efforts, is important from a microbiological standpoint. Bryophyte Sampling Protocol We established a stratified sampling following a floristic habitat sampling approach. That is at each locality we identified the different vegetation types and their mesohabitats. For example, at Sierra dez Bahoruco, Cachote sector, we sampled at: mature Cloud forest, palm break, riparian forest edge, and coffee plantation; while at Sierra de Neiba transects were placed at: mature cloud forest interior and edge, secondary cloud forest interior and edge, pine forest, and savanna. In each mesohabitat sampled we set one transect that was divided into 1-m2 subunits and species data were recorded from ground level up to two meters height. In each subunit we recorded substrate heterogeneity and their percent cover using a ranking scale (1=25%, 2= 25-50%, 3= 50-75% and 4= 75-100%). Subsequently, we collected the moss species and scored their substrate type and cover within each substrate using the same ranking scale described above. This process was repeated for each subsequent 1-m2 until no new species were found; that is, when the species accumulation curve reached a plateau. Micro-canopy Structure Protocol
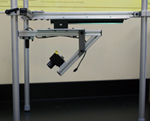
To determine the micro-canopy structure of the dominant bryophyte species, we collected 6 replicates of 10 cm each, and placed each in a plastic container. We used the LED MOSS SCAN, designed by Steven Rice from Union College, to obtain digital images of bryophyte canopies surface profiles. From each sample we obtained 26 digital images produced from a LED beam reflection that was run every 2 cm along a 10 cm transect. The digitized images were analyzed with a semivariogram (captures the variance of ‘empty spaces’ per unit of space = roughness) to estimate the semivariance γ. This semivariance was subsequently used to estimate fractal dimension (D). The semivariance characterizes the average semivariance squared in canopy depth at various distance scales (Rice et al. 2001) and it was estimated following the methods of Rice at al. (2001).
Microcrustacean Diversity Protocol Microcrustaceans were primarily sampled from bryophyte genera that differed in terms of micro-canopy structure. In the field, 100 cm2 mats were cut and placed in plastic boxes with wet filter paper on the bottom. Six replicates were collected for each bryophyte genus. Upon arrival to the Field Station, crustaceans were released from the vegetative material by placing the vials in a vortex and subsequently a floatation technique created by adding a saturated sucrose solution over a two minute period or a kerosene solution for a longer period of time. The supernatant was transferred to a small Petri dish and scanned under a dissecting scope to collect the micro-crustaceans. The mats were inspected under a dissecting scope to collect the undetached specimens. Animals for light microscopy were mounted into Hoyer’s solution and dissected with minute pins. Descriptions of the diagnostic body parts were collected for every species. Pictures were taken with a camera fitted with a 1-5 Macro lens. Additional figures were drawn using a compound microscope fitted with phase-contrast lenses and a camera lucida. Slides will be deposited in the David Frey Crustacean Collection (U.S.N.M.), and reference slides or vials will be available from the Biology Invertebrate Collection, University of Puerto Rico-Mayagüez. Protocol for Microcrustaceans Six replicates from 11 bryophytes that differed in terms of canopy structure were collected to assess microcrustacean diversity. Besides the four replicates of Octoblepharum, Bazzania, Leucoloma, Pyrrhobryum, Thuidium and Herbertus (approx. 50 cm2 each) that came from the split samples used to study the testate amoeba, two additional 50 cm2 pieces of the previously-mentioned bryophytes were used. There was not enough material to inspect Acroporium for microcrustaceans. Six other 50 cm2 replicates were also obtained for Monoclea (LR= low rugosity), Riccardia (LR), Leucobryum (LR), Zelometeorium (HR= high rugosity) and Plagiochila (LR). After removal of the brown portion, the green vegetative portions were placed in plastic boxes with wet filter paper on the bottom.Upon arrival to the laboratory crustaceans were released from the vegetative material by placing the vials in a vortex and subsequently, using a floatation technique. The latter was accomplished using a saturated sucrose solution over a two minute period. The supernatant was transferred to a small Petri dish and scanned under a dissecting scope to collect the microcrustaceans. Bryophyte portions were inspected under a dissecting scope to collect the undetached specimens. In the field specimens were preserved in 80-85% alcohol. At the Aquatic Biology lab at UPRM, representatives of each microcrustacean species were mounted on a slide with Hoyer's solution, or an equivalent, following the curatorial precautions suggested by personnel in the U.S. National Museum (USNM). Animals for light microscopy were mounted into Hoyer's solution and dissected with minute pins. Digitized images were taken with a Cannon ED50 camera fitted with a 40X objective1lens. Descriptions of the diagnostic body parts were collected for every species. Reference slides and specimens stored in 80% ethanol are available from the Biology Museum and the INV COL (Invertebrate Collection) at University of Puerto Rico- Mayaguez. Protocol for Testate Amoebae Four replicates from bryophyte species that differed in terms of canopy structure and that were collected from the same floristic profile were used to test whether there were differences in testacean diversity. Two mosses Acroporium pungens (Hedw.) Broth. and Octoblepharum erectifolium Mitt. ex R.S. Williams, and one liverwort, Bazzania sp., represented low canopy rugosity (LR); in contrast Leucoloma serrulatum Brid. and Herbertus juniperoideus, a moss and a liverwort respectively, represented medium rugosity (MR). Two mosses: Phyrrhobryum spiniforme (Hedw.) Mitt., and Thuidium urceolatum Lorentz were classified as having high rugosity (HR). From the bryophyte mat or cushion we removed, using scissors, the green vegetative component to ensure that we captured the community of testate amoebae associated only with the canopy. These samples were splitted into two subsamples each: one to assess testates and the other, microcrustacean diversity. The testacean subsample (~3-5 g of wet bryophyte) was placed in a 50 mL centrifuge vial with 5 mL of distilled water. Given the field conditions, the sample was homogenized by manual agitation for 45 s, and the solution was subsequently filtered through a 350 μm pore Nitex Nylon (SEFAR ®) mesh to allow large species such as Nebela militaris and Apodera vas to be collected. A subsample of 2 mL from the filtrate was fixed into Bouin’s (Acosta-Mercado & Lynn, 2003). The testate amoebae were attached to gridded filters (Sartorius Cellulose Nitrate 1.2 μm) and stained using the Edaphic Quantitative Protargol Stain method (Acosta-Mercado and Lynn, 2003). Live testaceans were enumerated on permanent slides and identified by comparing digitized images and morphometric measurements with those published in the literature. The concept of morphospecies was used when species could not be identified. In order to make comparable reports with the literature, a conversion factor was determined using the change in weight after drying the bryophyte and calibrating the equivalent moisture level. In order to determine whether differences in richness and density also translate into changes in testate amoebae biomass we used geometrical shapes and conversion factors following (Scröter, 2001). |
|
University of Puerto Rico Biology Department Carr. 108 Barrio Miradero Km 1.3 Mayagüez ,PR 00680 787-832-4040 ext. 3900, 2405 |
Bryodome.uprm.edu Project leaders:
|